A wide range of interesting and detailed statistics, and accompanying analysis, can be seen in the various publications of the Office of National Statistics, the Cabinet Office and the Institute for Government (IfG).
- The Institute for Government regularly publishes detailed analyses of civil service employment data, as well as much other interesting data, in its Whitehall Monitor series.
- Detailed Civil Service Statistics are published annually by the Office of National Statistics; and a sample of these spreadsheets, are in the statistics section of my online reference library.
This web page contains brief summaries of key statistics and a little supplementary information. You can click on most of the charts and other images to bring up larger versions.
What Do They Do?
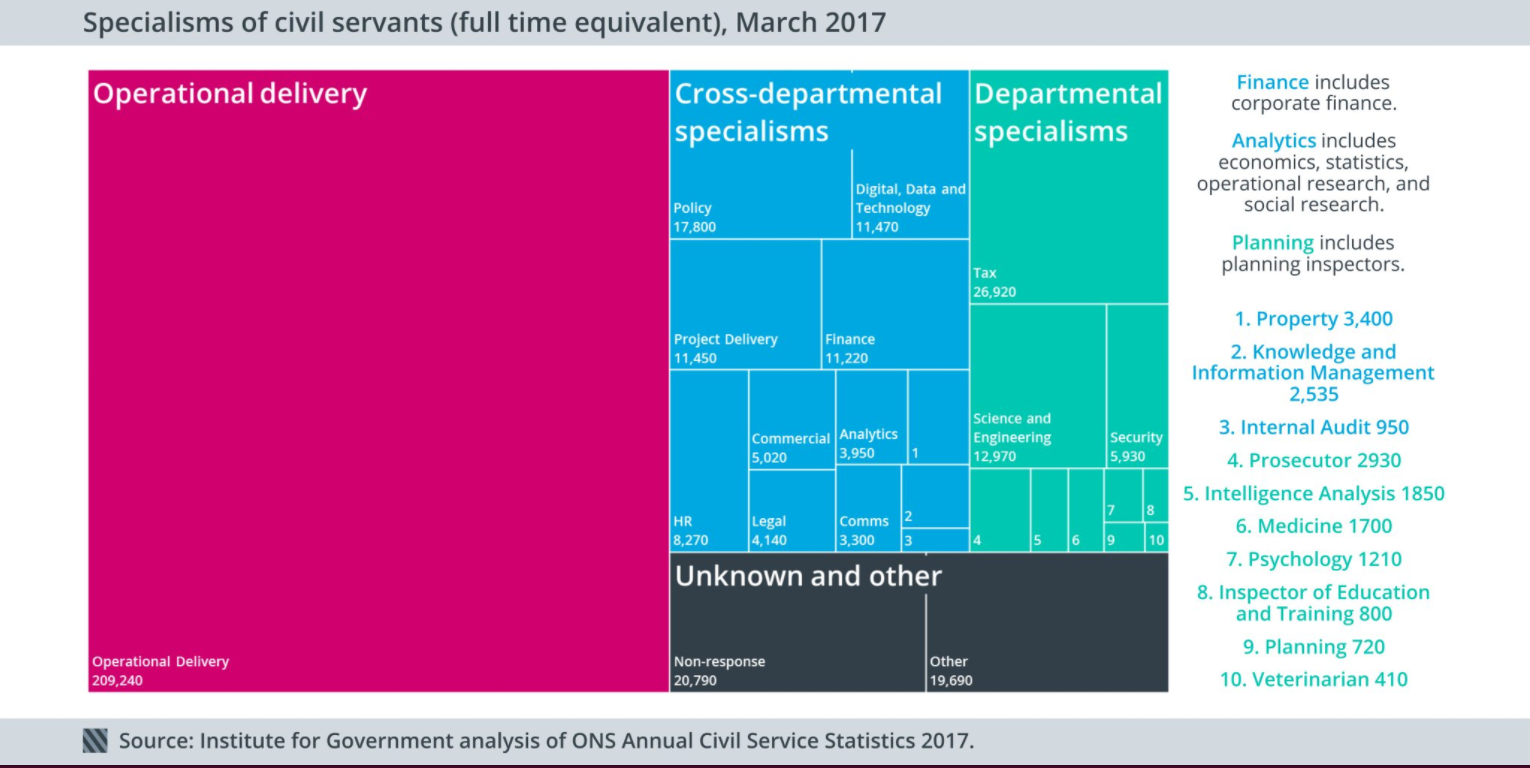
The IfG chart, below, provides an excellent summary of civil servants' occupations. Note, though, that the division into the various categories is hardly an exact science. Tax specialists, for instance, might also be described as operational staff. The footnotes to table 8 of Civil Service Statistics provide important and useful further detail if you need it.
A short summary might be that:
- Around 70% of civil servants have public-facing jobs, including paying pensions and other benefits, processing visa and driving licence applications, checking passports, working in courts, managing prisoners, collecting taxes, and helping people find jobs.
- Other civil servants work in the security services, in the Ministry of Defence, improving the transport infrastructure etc.
- It is unlikely that there are more than a couple of thousand officials who have regular and frequent contact with the c.100 Government Ministers.
Grades
This IfG chart shows the numbers in the main grades, and some interesting trends. Note in particular that the number of staff in the lowest grades continued to fall even when more senior grades were being recruited in large numbers.
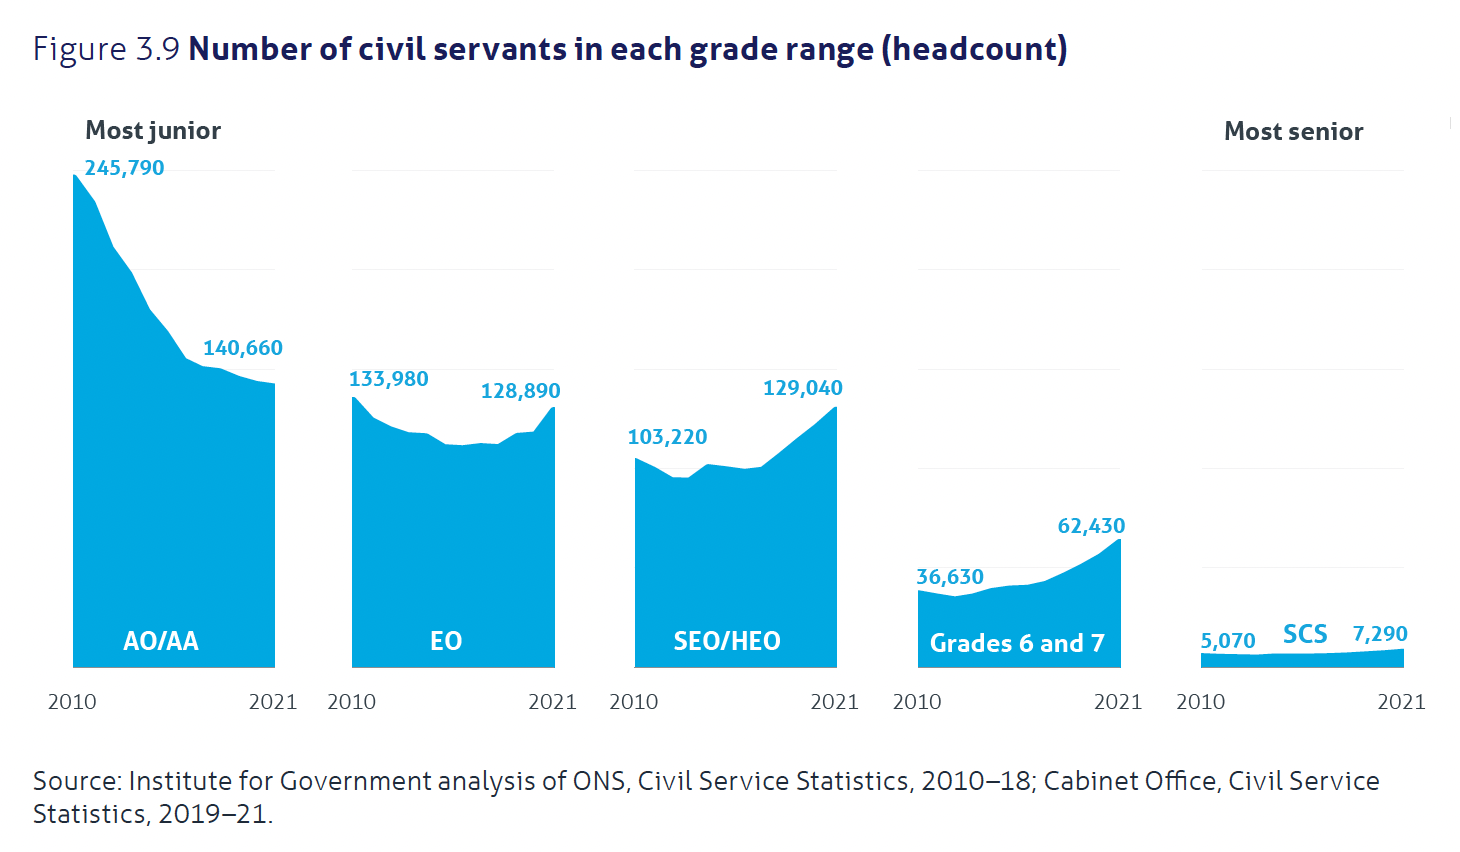
The numbers in each grade in 2024 were ...
AAs & AOs - 123,040 - 25%
EOs - 126,965 - 26%
HEOs & SEOs - 151,680 - 31%
Grade 7s and 6s - 77,990 - 16%
SCS - 7,295 - 1%
The Senior Civil Service (SCS)
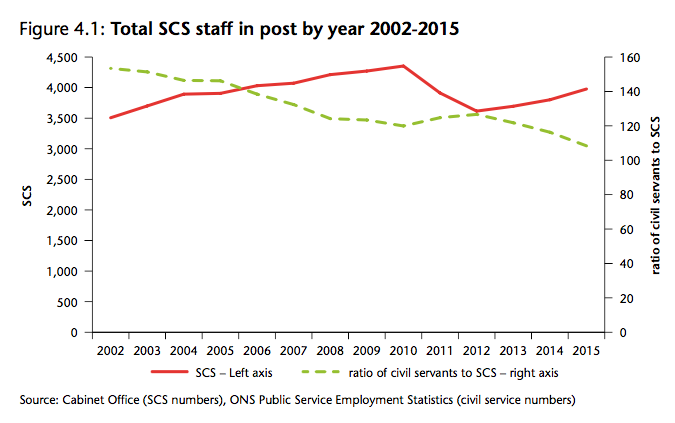
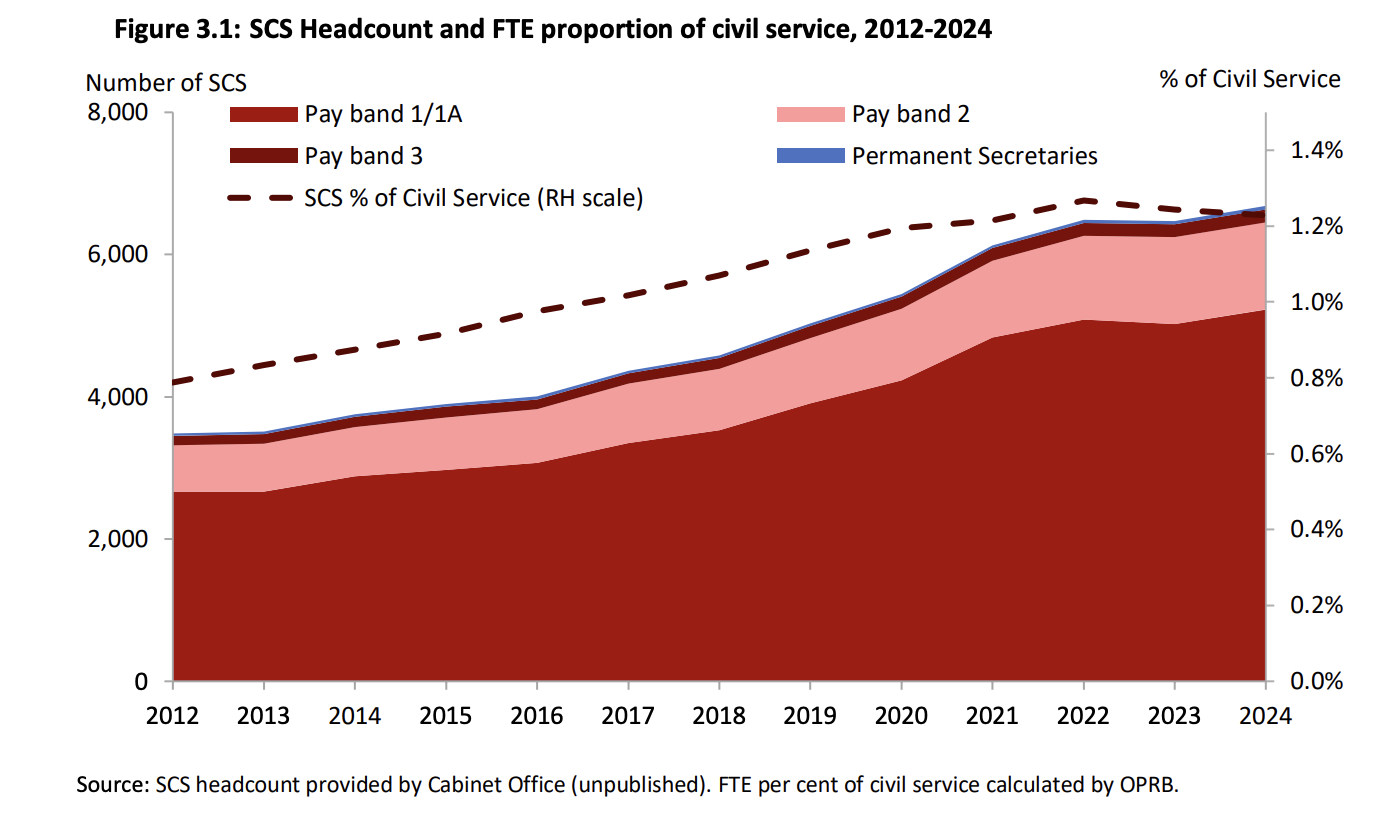
The above charts, showing striking 'grade drift' as a response to pay restraint, are taken from reports of the Senior Salaries Review Body.
Information about SCS pay may be found here.
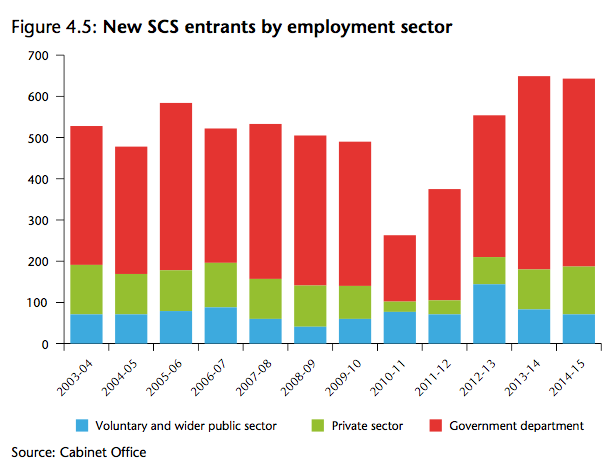
A high proportion of appointments to the SCS are from the wider public sector or the private sector. The Civil Service Commission oversees competitions for the most senior roles in the civil service – at director, director general, and Permanent Secretary level – and aims to ensure that key posts are filled on merit. 41% of the competitions it oversaw in 2015-16 led to existing civil servants being appointed. 33% came in from the wider public sector and 26% from the private sector.
The following chart looks at the data in a slightly different way. It includes recruitment and promotion to assistant director level, but excludes subsequent internal promotions. The result is a higher proportion of internal entrants to the SCS, but there are still plenty of appointments from outside.
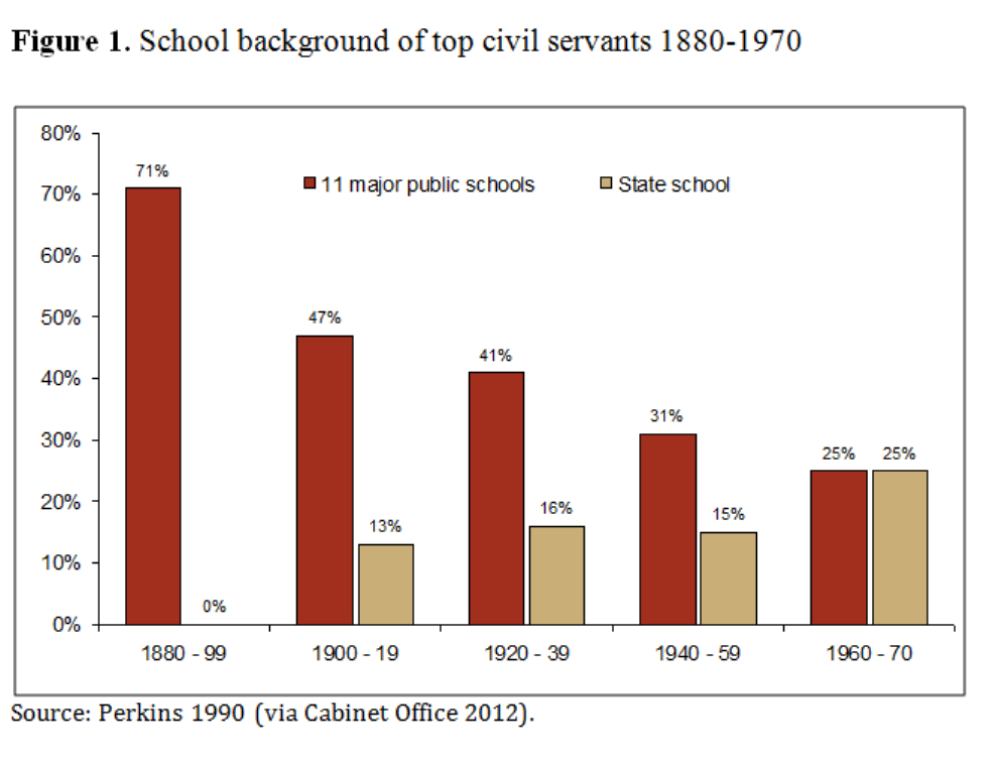
Contrary to its popular image, the Senior Civil Service (SCS) has become less dominated by ‘upper class’ backgrounds than is the case in many other professions. The proportion of ‘public school’ educated top civil servants has declined over the past century (see Figure 1), standing now at only 27% of the ‘Top 200’.
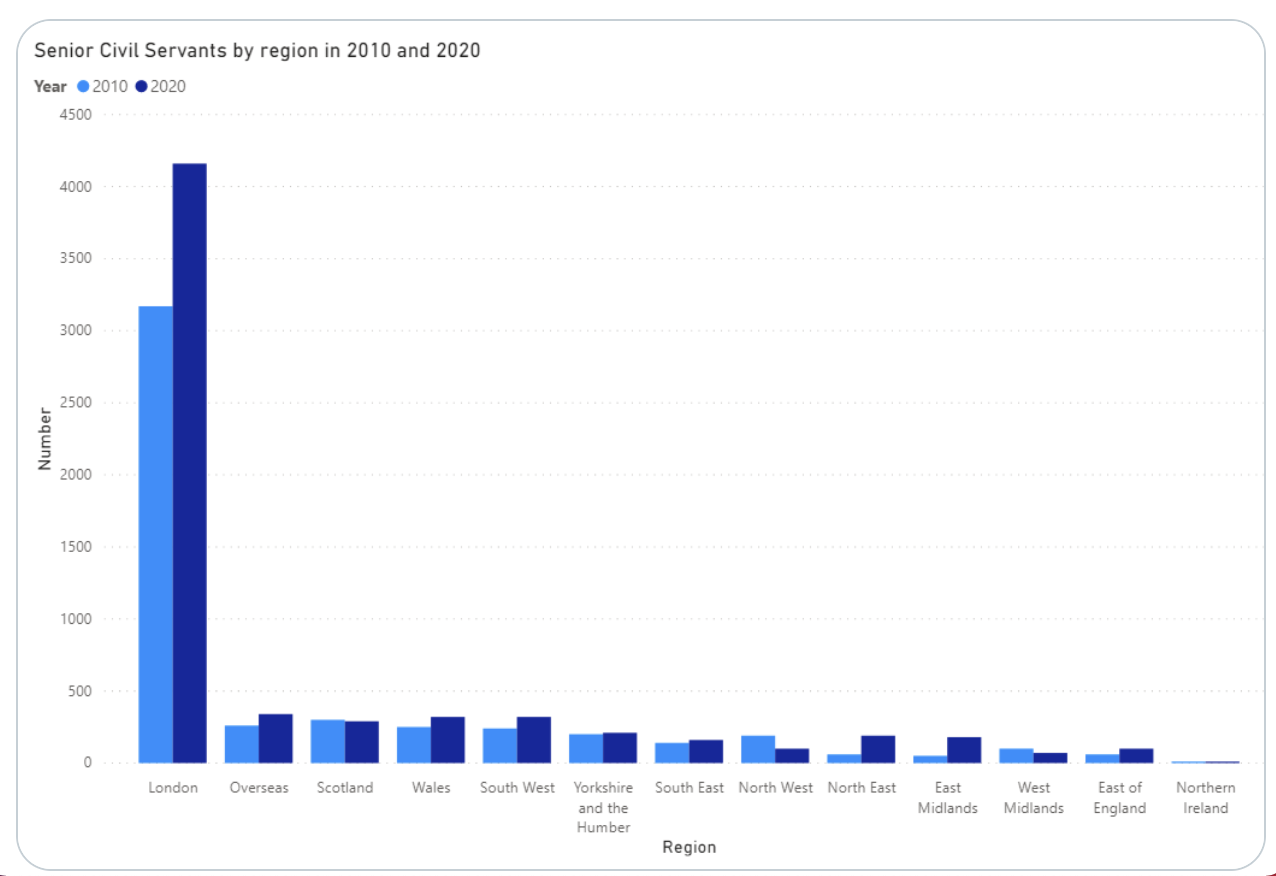
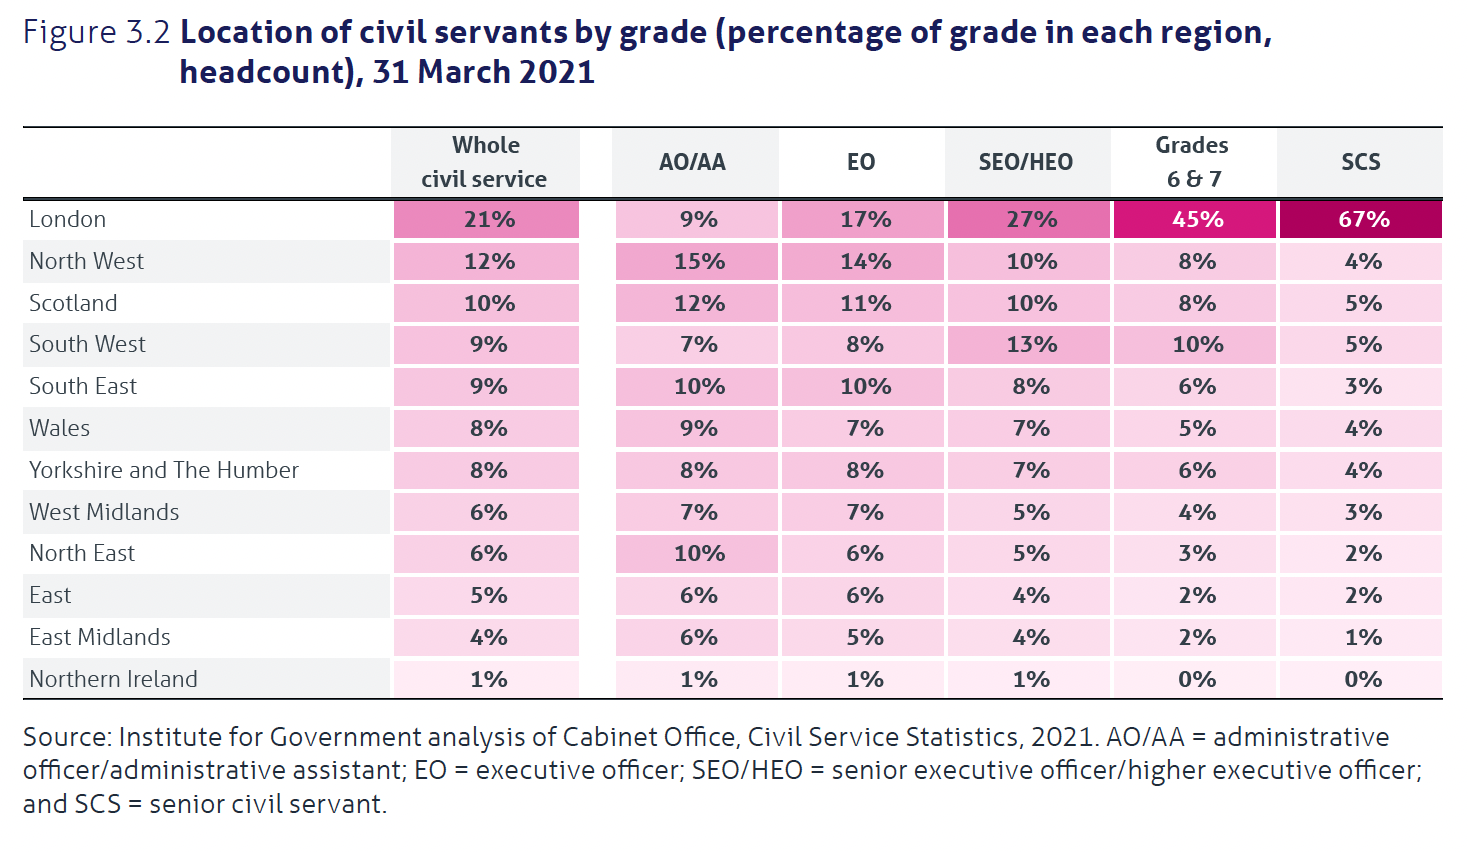
But it is noteworthy that (unlike the rest of the civil service) a very high proportion of the SCS (63% in 2010 and 64% in 2020) are employed in London.
Diversity
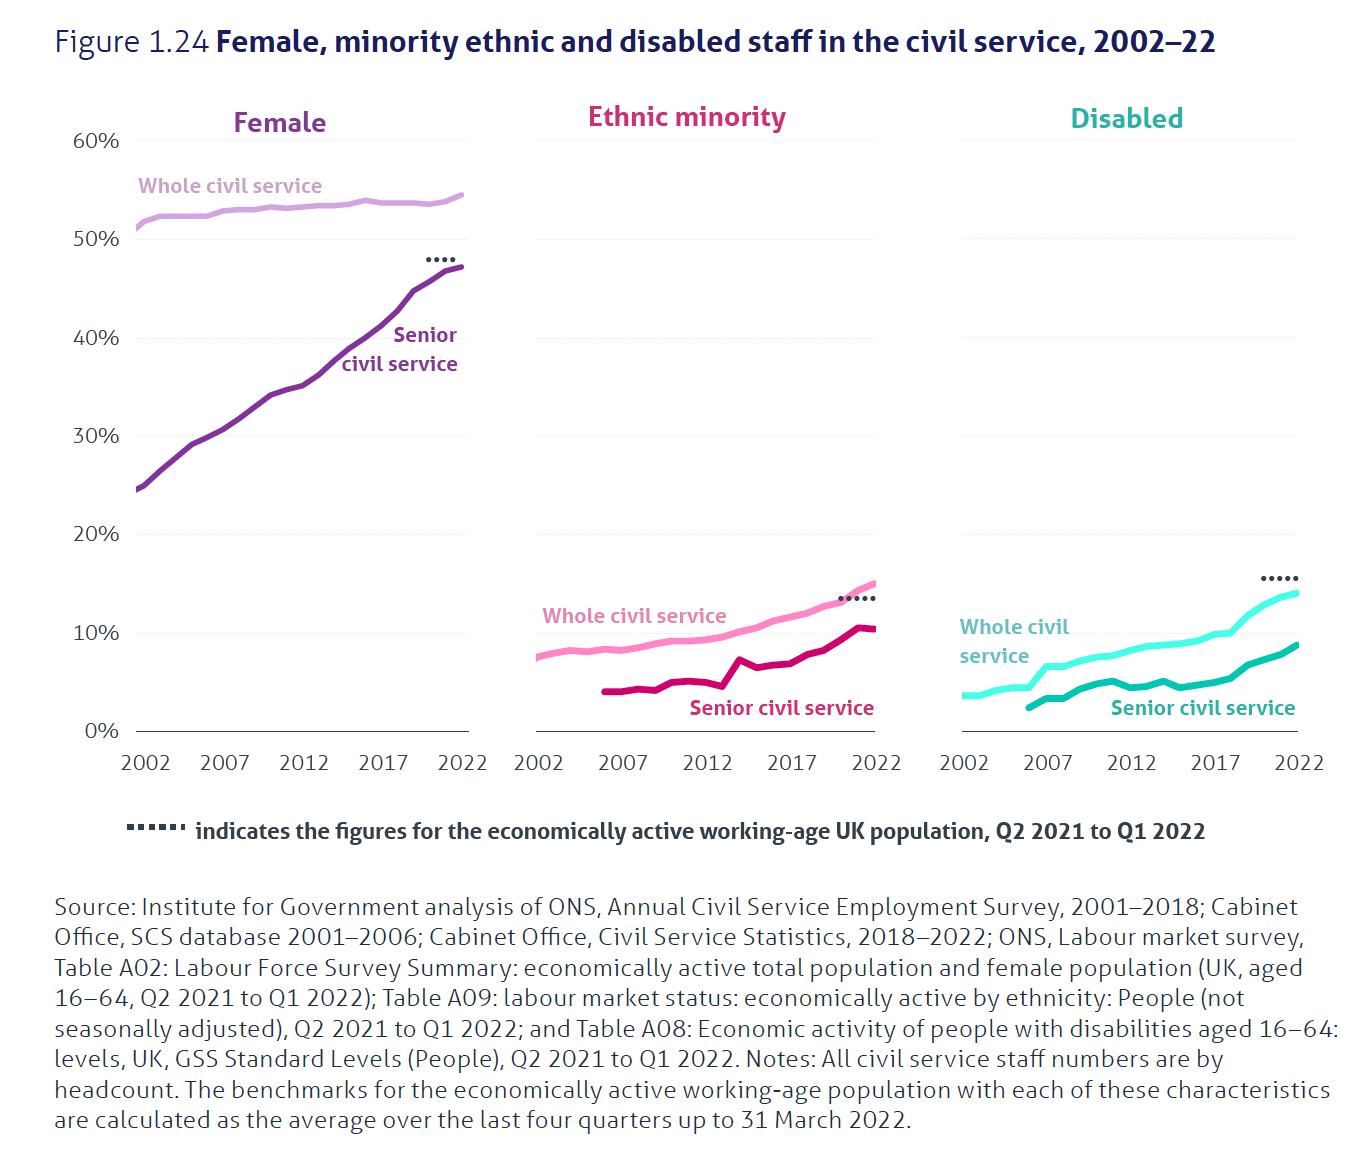
Here is a chart from the IfG that shows reasonably good progress on diversity:-
But we are still waiting for the first female and/or ethnic minority Cabinet Secretary. Here are the five most recent ones as at 2017 - from the left: Robert Armstrong, Robin Butler, Richard Wilson, Andrew Turnbull, Gus O'Donnell and Jeremy Heywood. Jeremy's two successors have also been white males.

Pay
Information about civil service pay may be found here. The full time median salary was c.£30,000 in 2020.
Retirement and Dismissal
Only c.16% of civil servants retire at or above their normal retirement age. Over 60% resign to follow other careers etc. (See also Can Civil Servants be Dismissed?.)
Regional Statistics
Another useful table from the IfG:
Departmental Statistics
The majority of civil servants work in only five very large departments:- DWP, the Ministry of Justice, HMRC, MoD and the Home Office..
Three or four of the smallest departments have fewer than 50 staff.
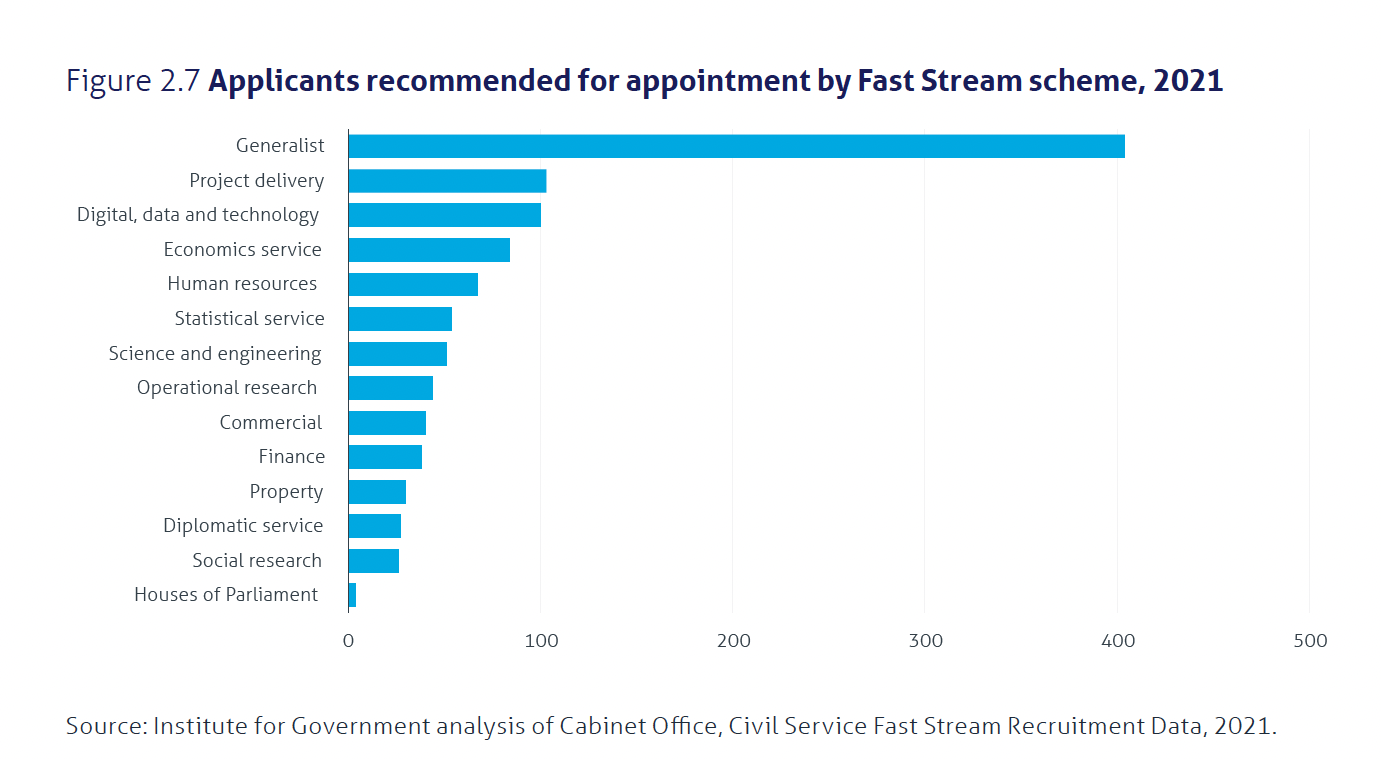
Fast Stream Recruitment
Most recruitment to the civil service is carried out by individual departments whose needs vary greatly from one to another, and from year to year. But around 1,000 particularly talented graduates - economists, engineers, lawyers, scientists, generalists and many others - are recruited each year via the Fast Stream Recruitment Scheme, chosen from around 20,000 applicants.
Here are the numbers recruited in 2021:
Further Information
Further detail is also available from the Cabinet Office and Treasury websites, and also in the annual reports of the Senior Salaries Review Body.
The Context for Civil Service Reform 2012 also contains some interesting data and charts.
And an annex to the Oughton Report reports some interesting statistics as they were in 1993.